
Operations · Guide
One set of sales figures, two stories from an AI chart
Compare truncated bars, zero-based bars and a dot plot using the same synthetic sales data to verify proportions and growth claims.
One set of sales figures, two stories from an AI chart
Original AAHouse explanatory video. AI-assisted conceptual visuals and neural narration; original music.
English transcript · Simplified Chinese Mandarin transcript · Taiwan Mandarin transcript · Macao Cantonese transcript
Read the numbers before the drama
A fictional U.S. stationery shop has October sales of $10,000 and November sales of $11,000. An AI-created presentation makes the second bar appear twice as tall as the first. The value labels are correct, but the visual impression has changed. This article uses synthetic data, not customer results or a test of a particular product.
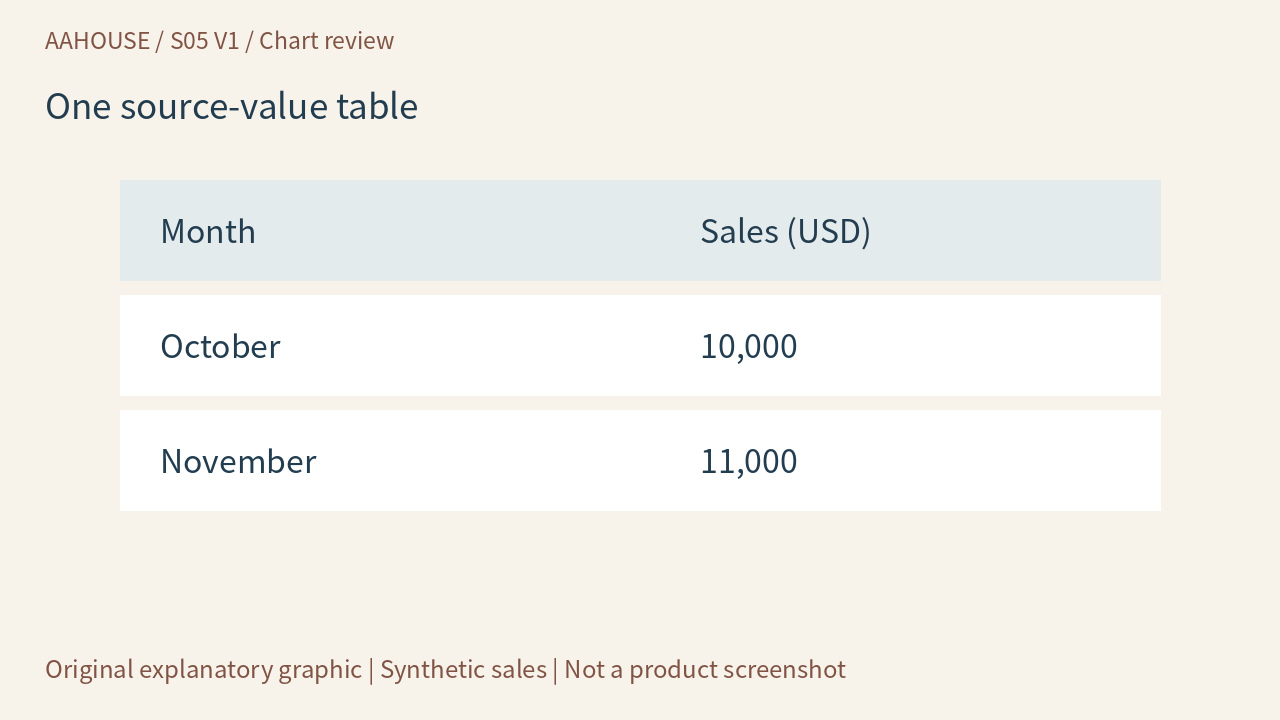
- Month
- Sales (USD)
- October
- 10,000
- November
- 11,000
Unchanged original source explanatory diagram.
Find the missing baseline
When the vertical axis begins at $9,000, the visible bar lengths represent $1,000 and $2,000. One looks twice as large, although sales increased by only 10%. The UK Government Analysis Function’s chart guidance explains that breaking a bar chart’s numerical axis distorts the relative proportions of its bars.[1] Reviewing only the labels above an AI-generated chart is not enough.
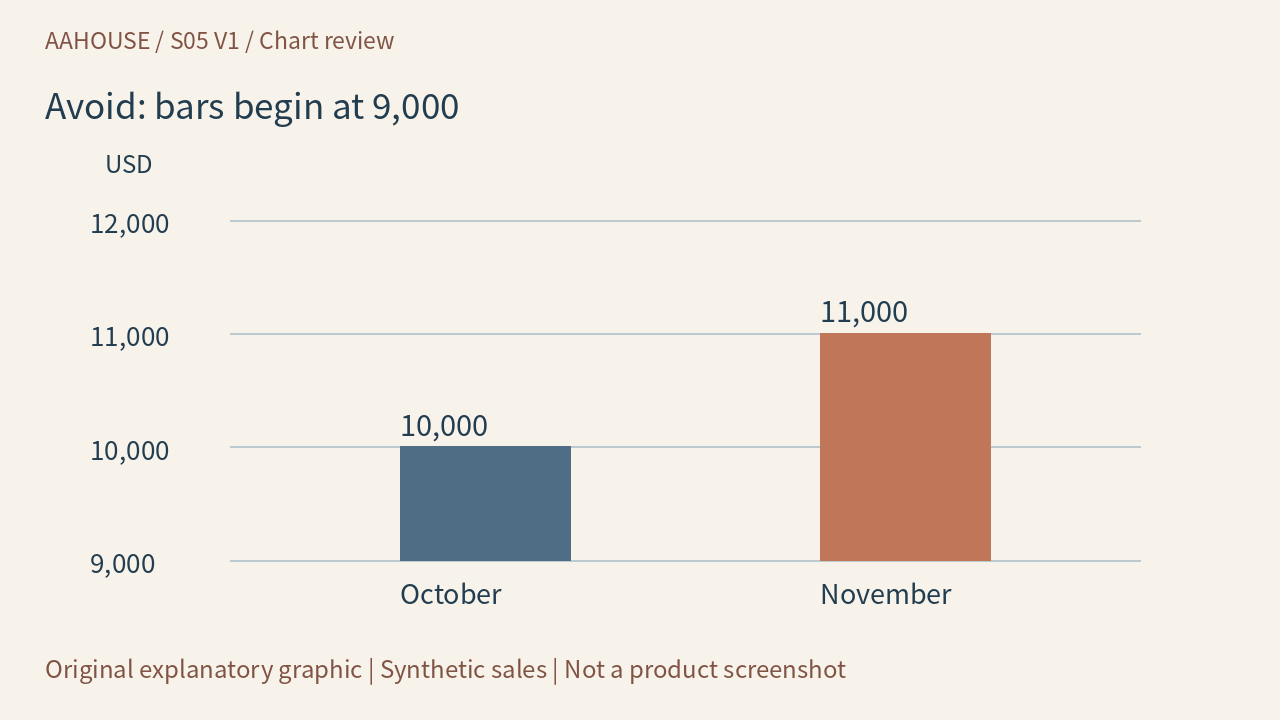
- USD
- 12,000
- 11,000
- 10,000
- 9,000
- 10,000
- 11,000
- October
- November
Unchanged original source explanatory diagram.
State what is being compared
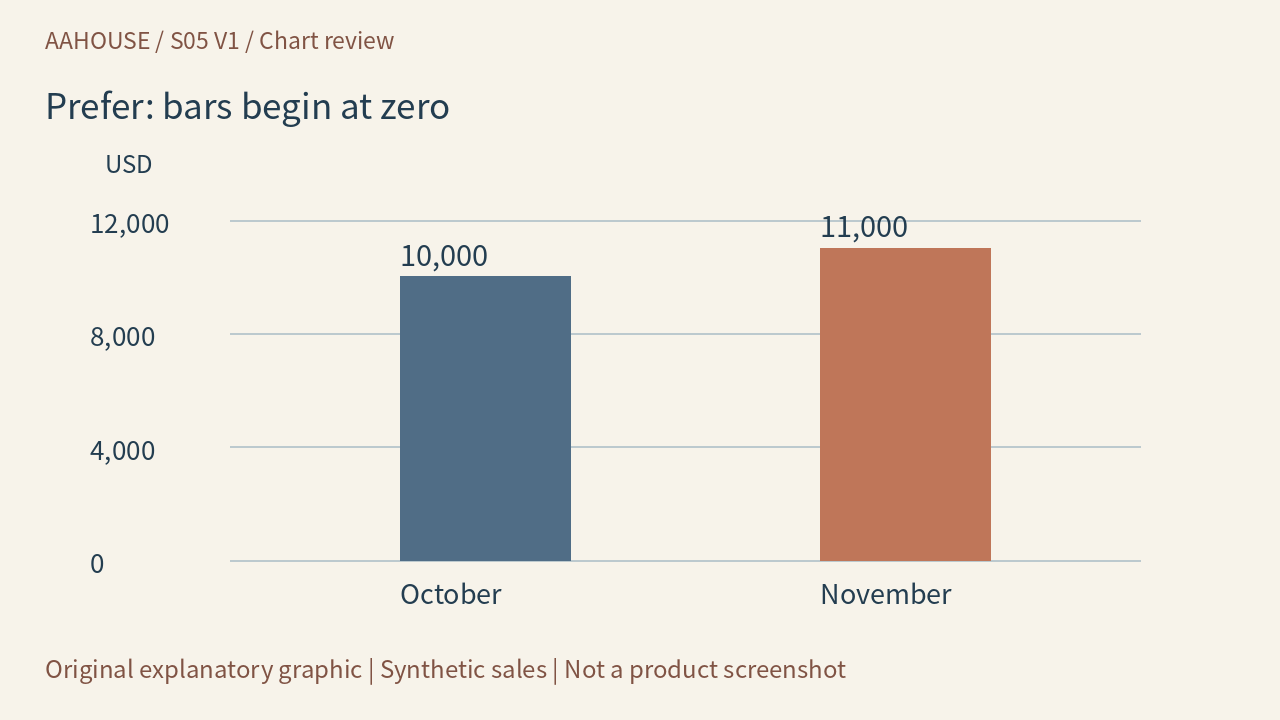
Return the same data to a zero baseline. Growth remains, without looking like a doubling. Use a title such as November sales increased 10% from October, and identify dollars, months and the synthetic example. Do not let an AI writer upgrade the claim to explosive growth. A sales increase is not a profit increase either; those claims require different evidence.
- USD
- 12,000
- 8,000
- 4,000
- 0
- 10,000
- 11,000
- October
- November
Unchanged original source explanatory diagram.
Show small changes with a different form
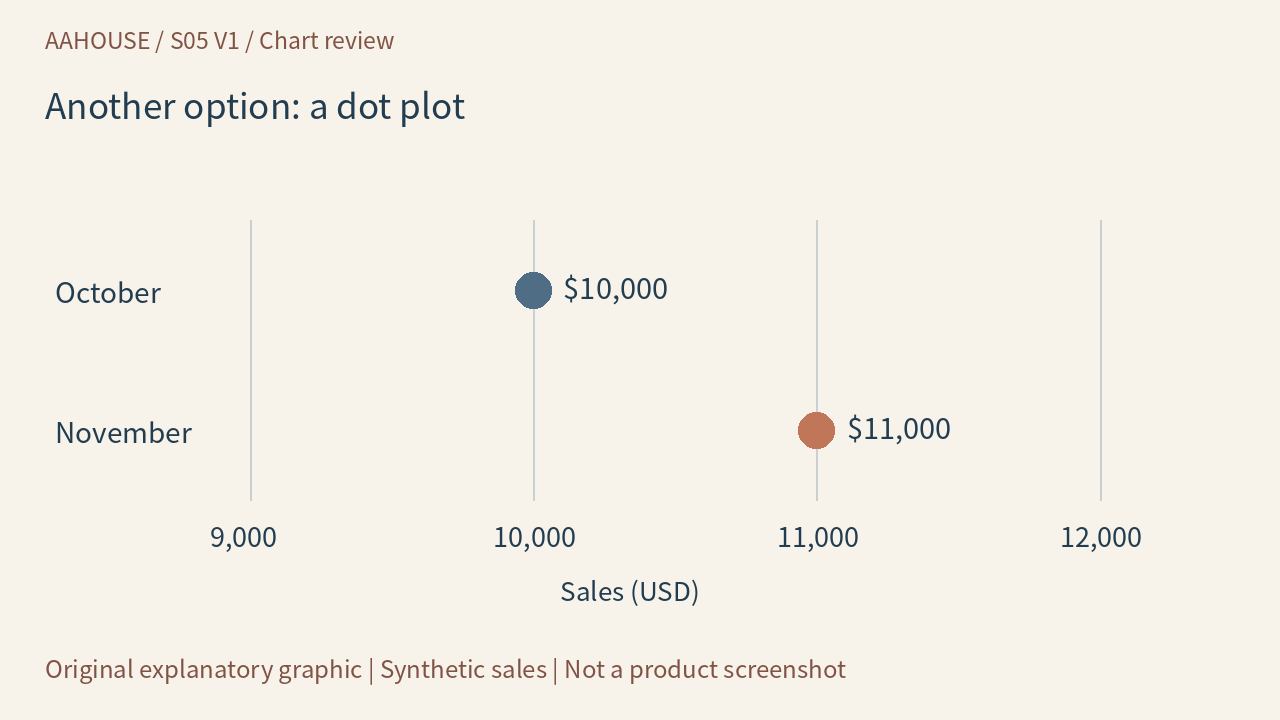
Not every chart must begin at zero. If small differences are the point, consider a dot plot with clearly marked ticks, or simply list the amounts and their difference. The same guidance suggests a dot plot when a zero-based bar chart does not communicate the story clearly.[1] Readers should know whether they are comparing position, length or change, rather than encountering a silently altered proportion.
- October
- $10,000
- November
- $11,000
- 9,000
- 10,000
- 11,000
- 12,000
- Sales (USD)
Unchanged original source explanatory diagram.
Give the generator a checkable specification
Ask AI for the source-value table, chart and one accurate conclusion together. Retain the data scope, units and calculation so a colleague can reproduce $11,000 minus $10,000, divided by $10,000. A deterministic plotting tool makes a data chart easier to verify than asking an image model to invent tick marks from prose. An original cover illustration may explain a concept, but it is not a precise statistical chart.
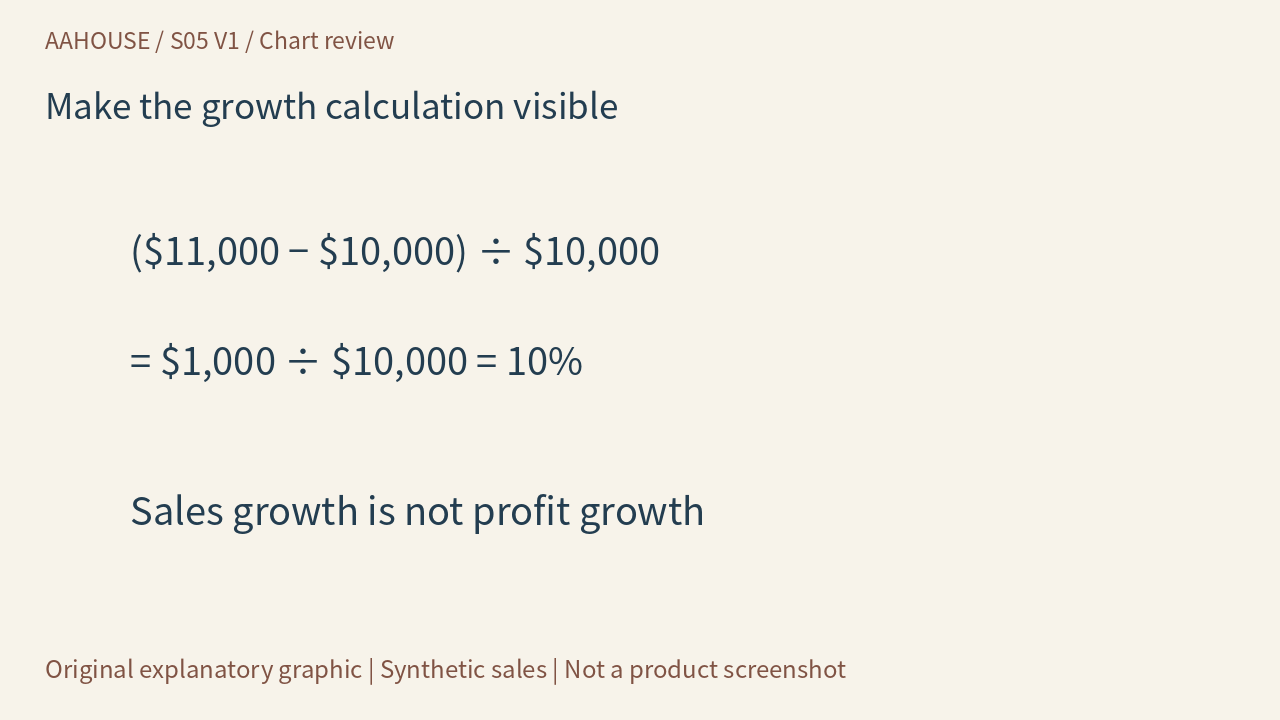
- ($11,000 − $10,000) ÷ $10,000
- = $1,000 ÷ $10,000 = 10%
- Sales growth is not profit growth
Unchanged original source explanatory diagram.
Use one minute at the next weekly meeting
Cover the title first. Read the axes, units and data scope, then check both endpoints against the source table. Finally ask whether the title would still hold if the baseline returned to zero. If not, fix the graphic and wording before sharing. AI can save formatting time, but someone must still check and own how honestly the chart communicates change.
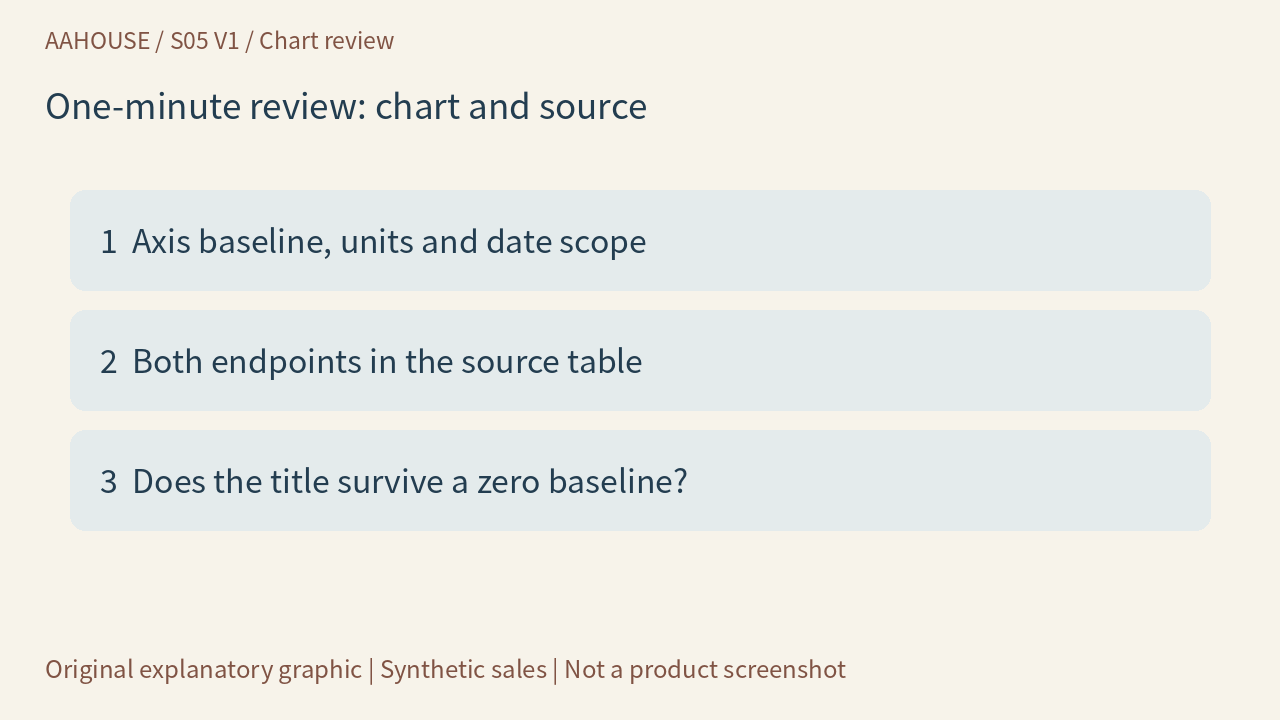
- 1 Axis baseline, units and date scope
- 2 Both endpoints in the source table
- 3 Does the title survive a zero baseline?
Unchanged original source explanatory diagram.