
Data · Guide
Three rows in an AI sales report may be only two orders
A local synthetic experiment shows how joins duplicate order totals and why deduplicating amounts can also miscount sales.
Three rows in an AI sales report may be only two orders
Original AAHouse explanatory video. AI-assisted conceptual visuals and neural narration; original music.
English transcript · Simplified Chinese Mandarin transcript · Taiwan Mandarin transcript · Macao Cantonese transcript
Why does one order appear twice?
Give AI an orders table and an order-items table and ask for a sales summary. Consider fictional data from a U.S. studio, with all amounts in dollars: order A totals 100 and has two items; order B totals 60 and has one. The order total is 160. Joining the tables produces three rows. Summing the order total on every joined row produces 260. The model can reach a wrong conclusion without inventing a single number.
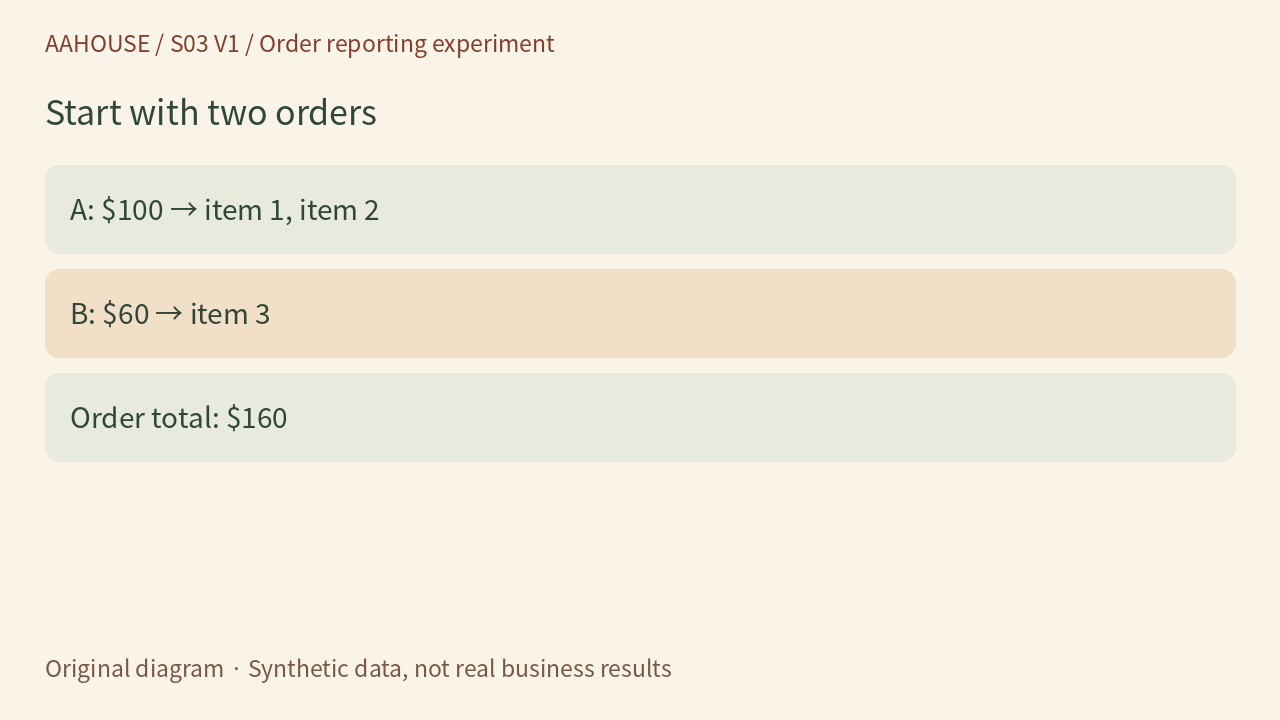
- A: $100 → item 1, item 2
- B: $60 → item 3
- Order total: $160
Original diagram · Synthetic data, not real business results
The question is what one row represents
One row in orders represents an order; one row in items represents an item. PostgreSQL documents that an inner join produces a row for each right-side match satisfying the join condition for a left-side row.[1] A’s 100 appearing twice is a consequence of the join, not two payments. Before AI writes the query, specify “count each order once,” rather than merely asking it to summarize the tables.
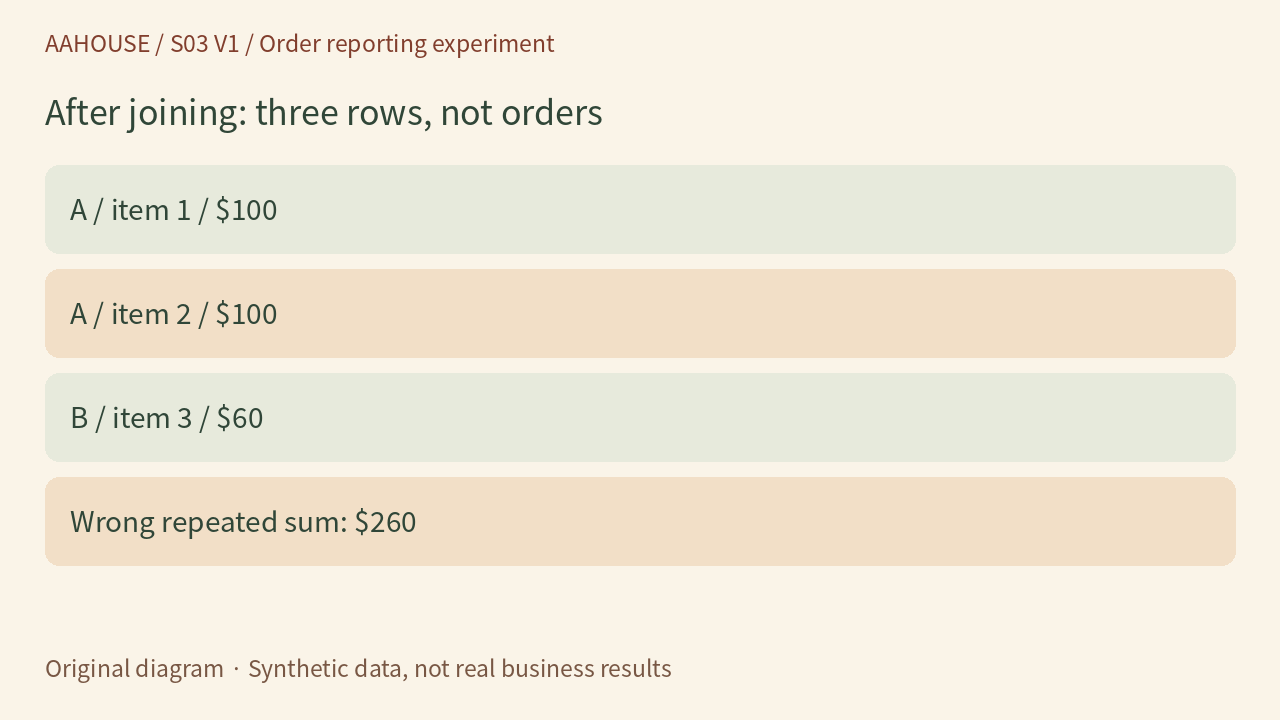
- A / item 1 / $100
- A / item 2 / $100
- B / item 3 / $60
- Wrong repeated sum: $260
Original diagram · Synthetic data, not real business results
DISTINCT is not a universal repair
Deduplicating amounts does not fix the problem. Add order C, which also totals 100 but is a separate real order. The correct total becomes 260. SUM(DISTINCT order_total) keeps only the values 100 and 60, yielding 160. DISTINCT applies to expression values, not business identity.[2] A deduplication key must identify the business object. Equal amounts do not make two orders duplicates.
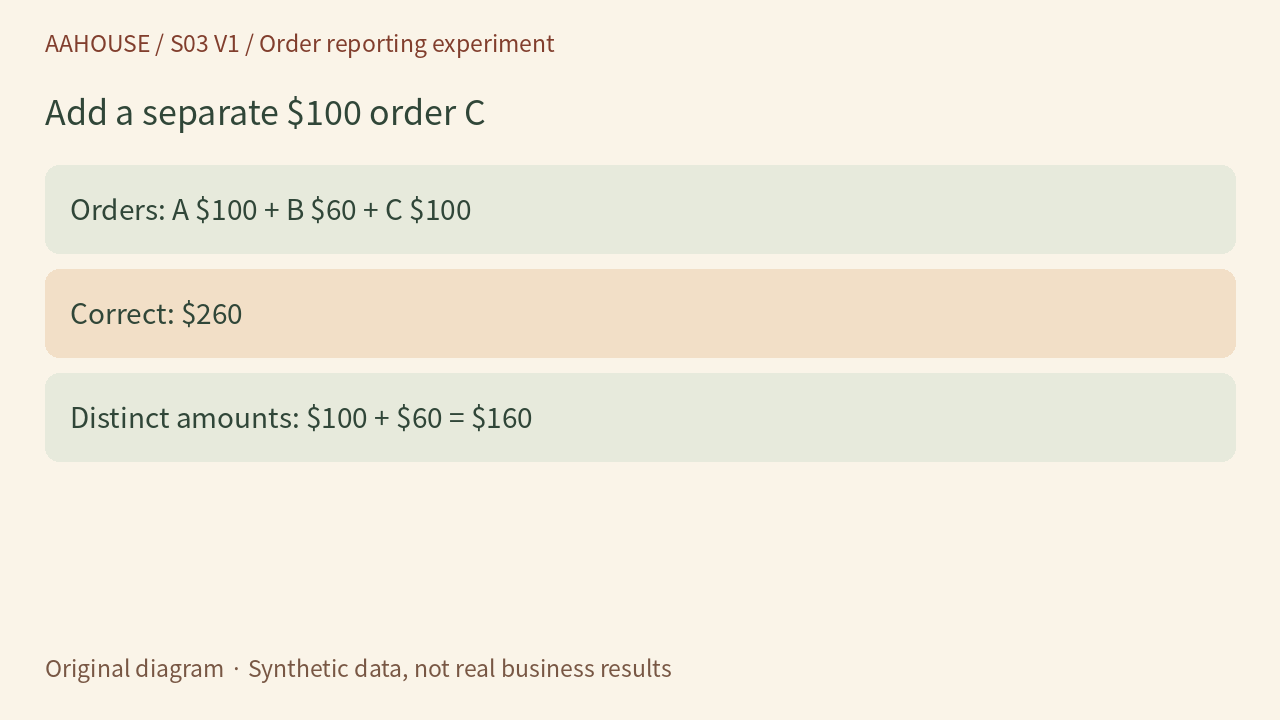
- Orders: A $100 + B $60 + C $100
- Correct: $260
- Distinct amounts: $100 + $60 = $160
Original diagram · Synthetic data, not real business results
Choose the reporting level before adding detail
If the question is simply the total of orders, aggregate the orders table directly. If item-level measures such as item counts are needed, first aggregate the items by order ID into one row per order, then join that result to orders. Our recommendation is to reconcile order totals and item counts separately. Do not allocate an order-level amount across products without an explicit allocation rule. This is reporting design, not an accounting or tax-recognition method.
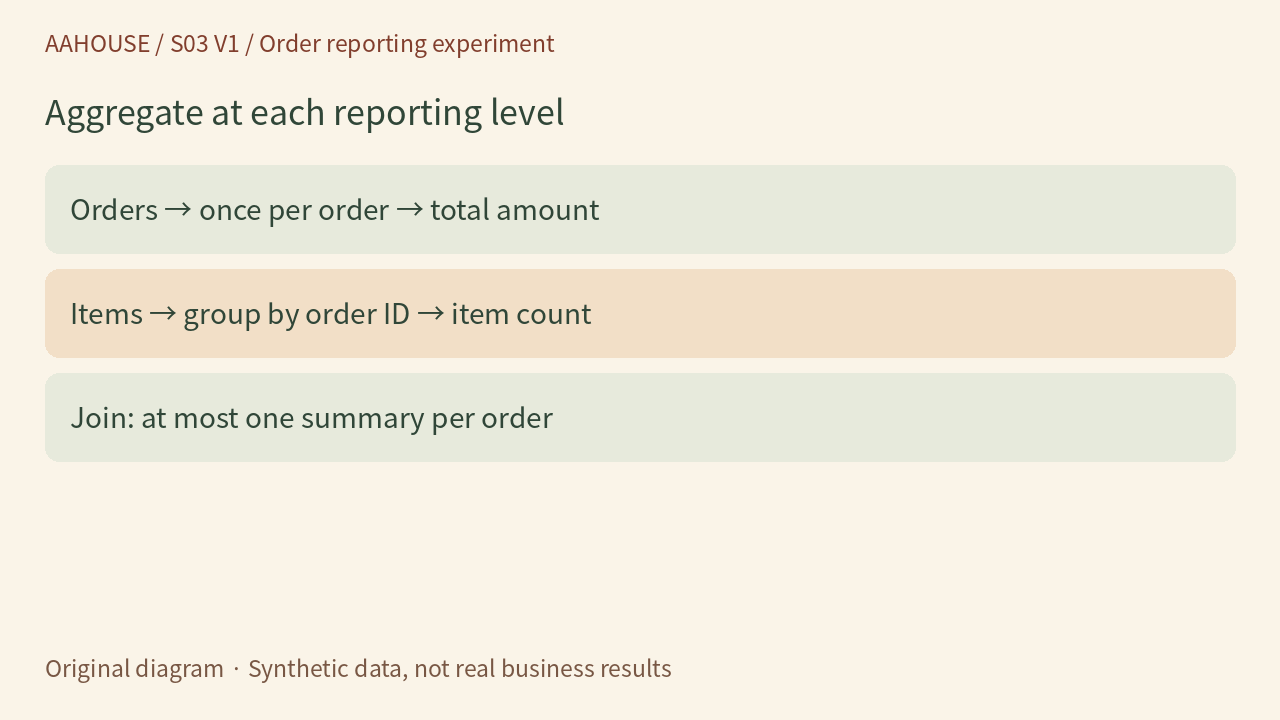
- Orders → once per order → total amount
- Items → group by order ID → item count
- Join: at most one summary per order
Original diagram · Synthetic data, not real business results
Test three orders, not a fluent explanation
Keep A, B and C as a fixed miniature test: three orders, four item rows and a total of 260. Add an order with no items to check whether it must be retained, and specify rules for refunds, cancellations and date ranges. We ran this synthetic experiment locally in SQLite and verified both erroneous repeated summation and erroneous deduplication by amount. We did not connect to a merchant database or test a production query.
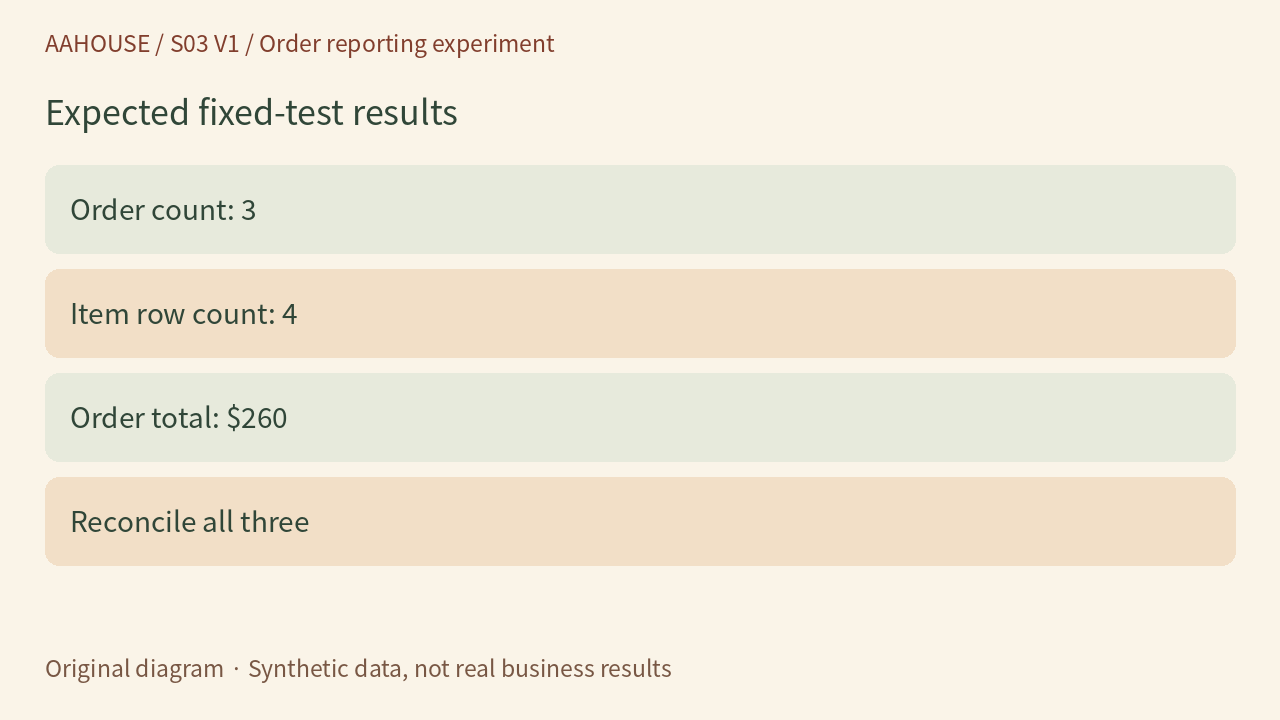
- Order count: 3
- Item row count: 4
- Order total: $260
- Reconcile all three
Original diagram · Synthetic data, not real business results
The next instruction to give AI
Try: “Explain what one row represents in each table and in the final result, then provide the query and check order count, item count and total against the fixed test.” Use AI to explain discrepancies and help generate tests, while the business owner confirms reporting definitions. Before release, retain the query version, input scope and test results. A tiny table that reconciles is more persuasive than a plausible-sounding sales narrative.
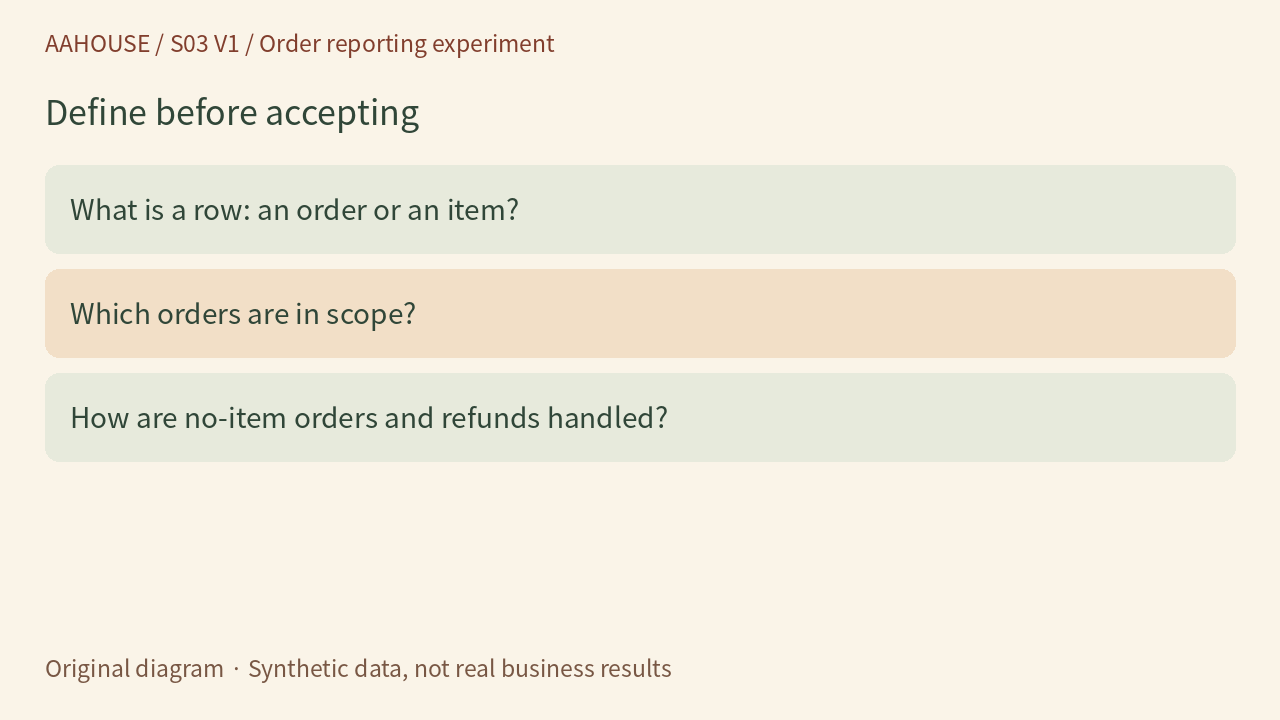
- What is a row: an order or an item?
- Which orders are in scope?
- How are no-item orders and refunds handled?
Original diagram · Synthetic data, not real business results