
Operations · Guide
A four-second average does not mean every customer waits four seconds
Look beyond average latency to measurement boundaries, percentiles, failures and timeouts when assessing customer waits.
A four-second average does not mean every customer waits four seconds
Original AAHouse explanatory video. AI-assisted conceptual visuals and neural narration; original music.
English transcript · Simplified Chinese Mandarin transcript · Taiwan Mandarin transcript · Macao Cantonese transcript
Start with deliberately fictional numbers
Imagine a U.S. florist using AI to organize custom orders. Of one hundred requests, ninety take one second each and ten take thirty-one seconds each. The mean is four seconds, yet ten customers wait more than half a minute. These are constructed numbers, not customer-test results. Before deciding whether that is fast enough, ask who is waiting and when the clock starts.
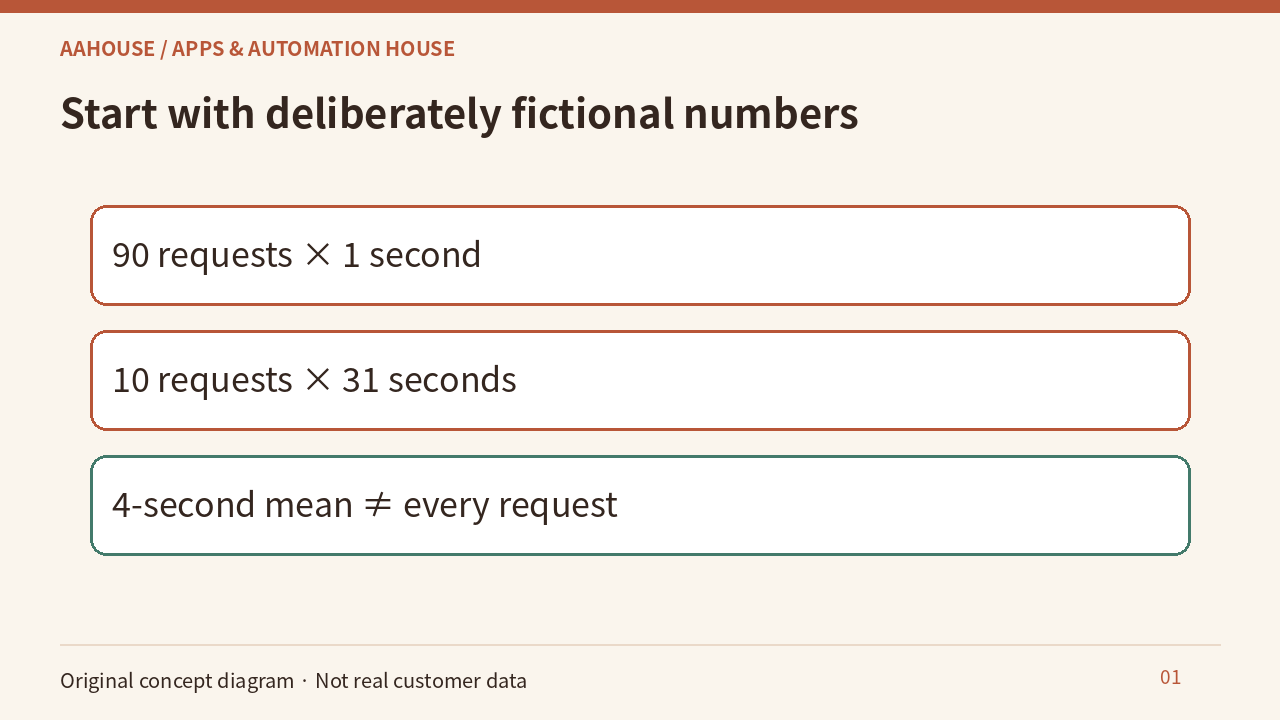
- 90 requests × 1 second
- 10 requests × 31 seconds
- 4-second mean ≠ every request
Unchanged original source explanatory diagram.
An average cannot describe every experience
Google’s SRE guidance warns that mean latency can hide a very slow tail and recommends looking at distributions.[1] Our recommendation is to show the median, higher percentiles, and sample count rather than only a mean. A percentile describes a position within an observation window. It does not guarantee the next customer’s completion time or constitute a service promise.
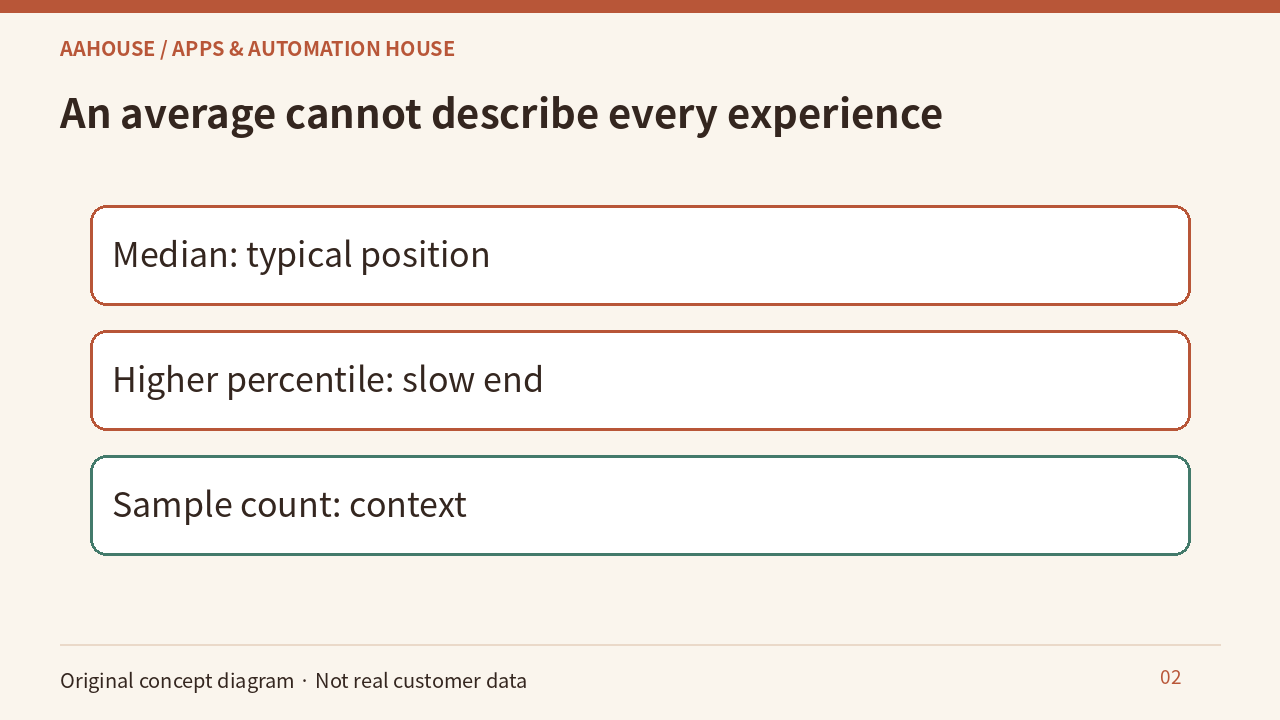
- Median: typical position
- Higher percentile: slow end
- Sample count: context
Unchanged original source explanatory diagram.
Write down the start and finish
Our recommendation is to distinguish click-to-usable-result time from model-start-to-first-output time. Queuing, retrieval, tool calls, and result checks can all add waiting. Compare charts directly only when the measured activity, start and finish, and time window match. The first visible words do not mean an order is complete.
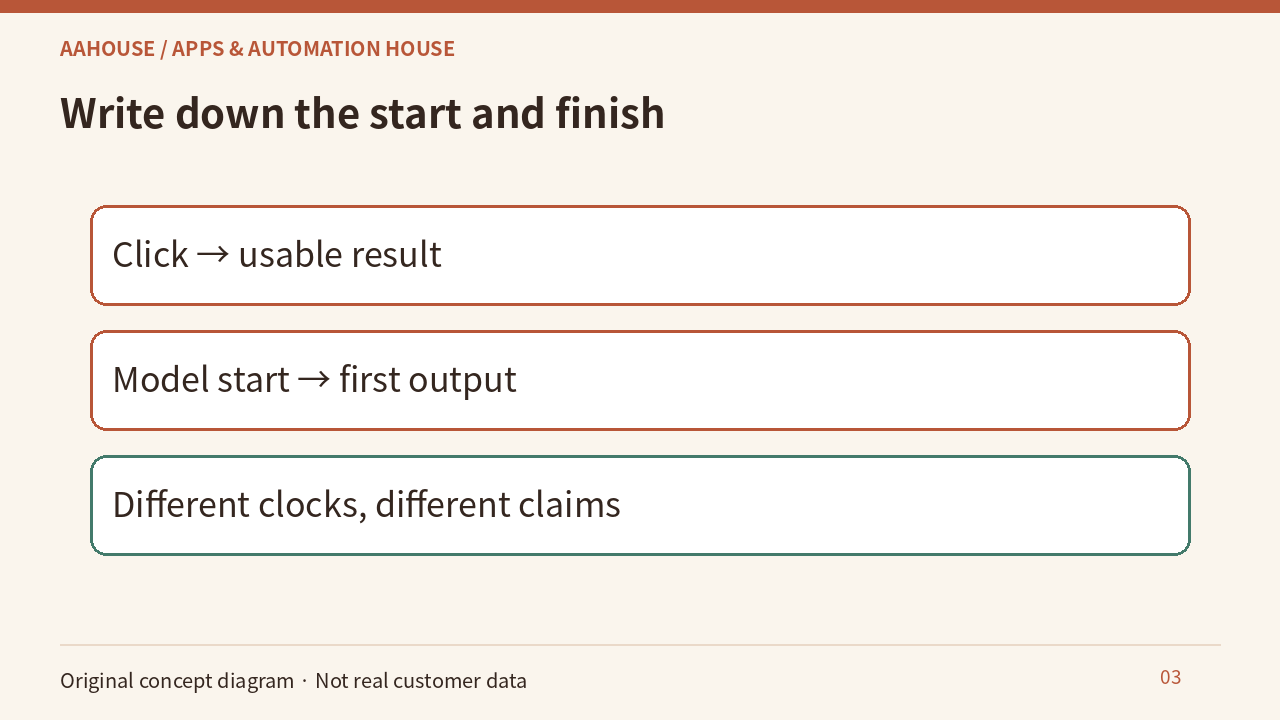
- Click → usable result
- Model start → first output
- Different clocks, different claims
Unchanged original source explanatory diagram.
Do not average already calculated percentiles
Prometheus documentation explains that precomputed quantiles cannot be aggregated directly into an overall percentile. Averaging percentiles across instances is misleading.[2] For a combined view, engineering teams should use correctly mergeable distribution data and examine estimation error. This is not a recommendation to replace a monitoring product; it is a request to inspect the calculation.
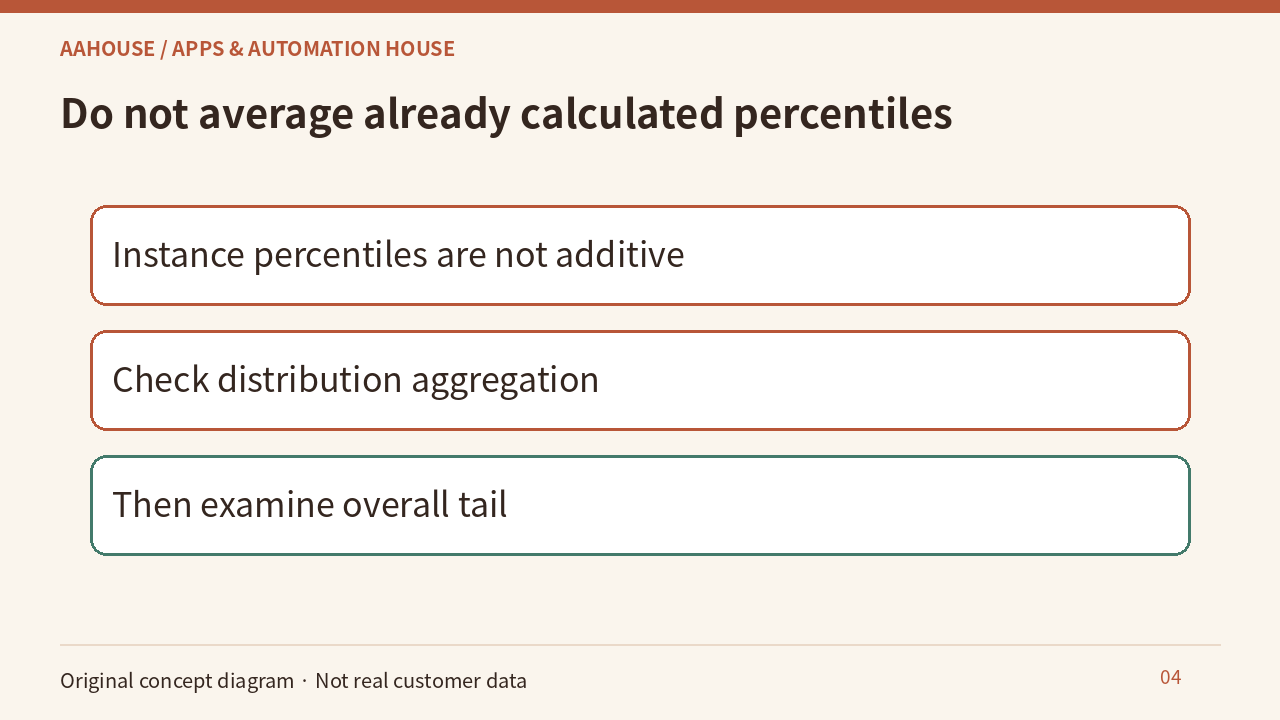
- Instance percentiles are not additive
- Check distribution aggregation
- Then examine overall tail
Unchanged original source explanatory diagram.
Keep failures visible
Show successes, failures, and timeouts separately, with their counts and definitions. Looking only at successful requests can remove the experience of customers whose requests timed out. Do not exclude inconvenient samples to improve a percentile. Clear progress messages and a human-help route can improve waiting, but better messaging should not be presented as faster processing.
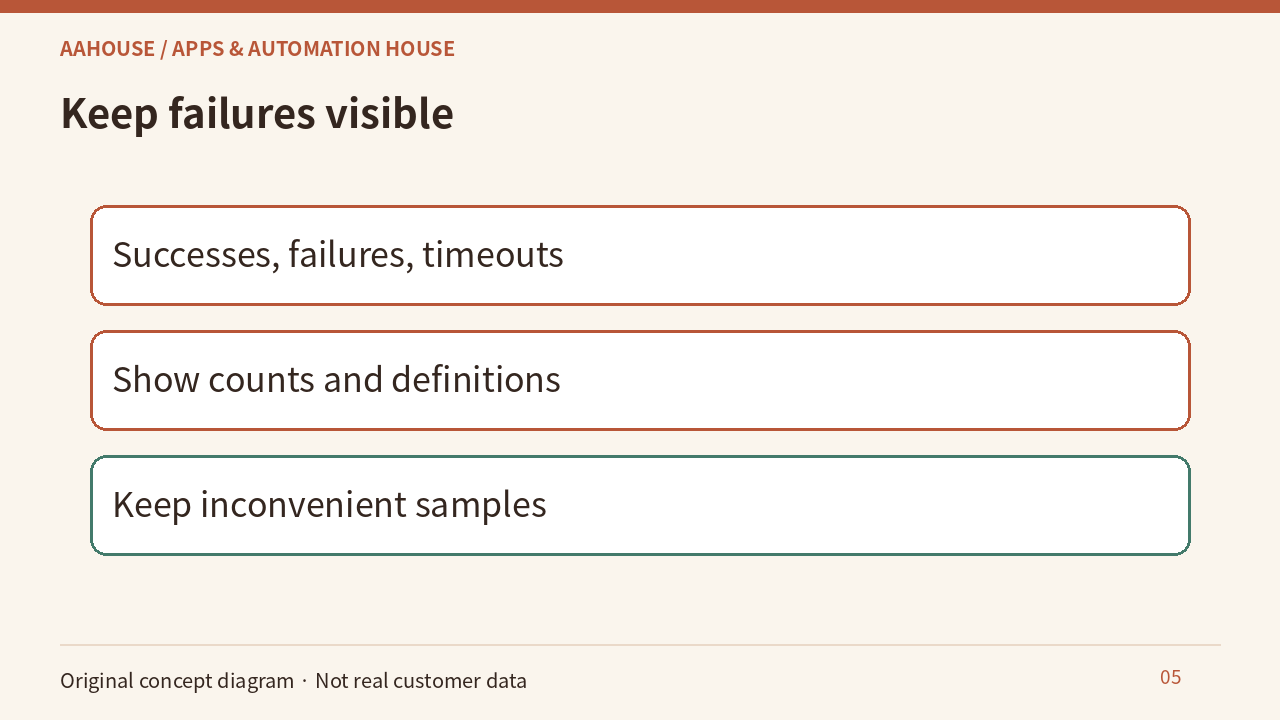
- Successes, failures, timeouts
- Show counts and definitions
- Keep inconvenient samples
Unchanged original source explanatory diagram.
Let a small experiment choose the next step
Prepare fictional ordinary orders, longer instructions, and cases needing additional retrieval. Record end-to-end duration, success, and human intervention. Set targets according to business needs and investigate slow requests. This is a proposed test plan, not a customer-system result. Locate the waiting before deciding whether to optimize the model or the workflow.
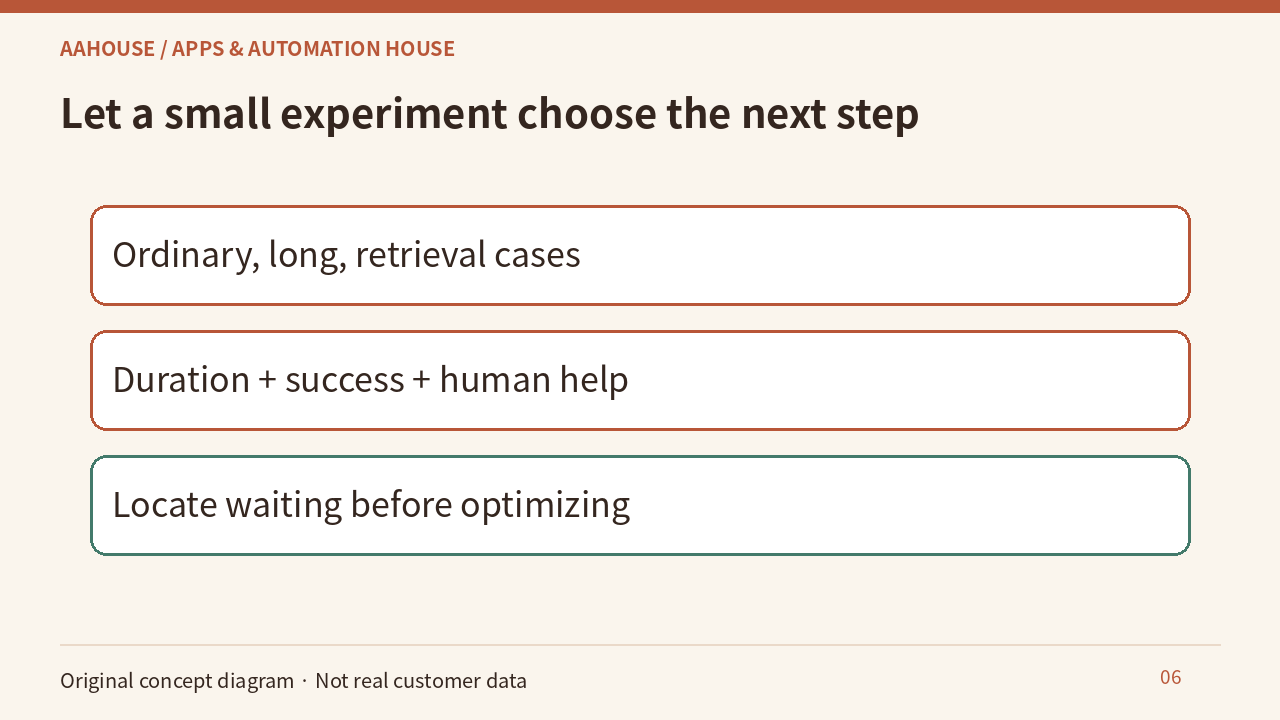
- Ordinary, long, retrieval cases
- Duration + success + human help
- Locate waiting before optimizing
Unchanged original source explanatory diagram.