
Operations · Guide
A blank in the weekly report is not automatically zero
Use synthetic orders to distinguish zero, null and no rows, preserving denominators and missing-data limits in AI reports.
A blank in the weekly report is not automatically zero
Original AAHouse explanatory video. AI-assisted conceptual visuals and neural narration; original music.
English transcript · Simplified Chinese Mandarin transcript · Taiwan Mandarin transcript · Macao Cantonese transcript
Do not turn a blank into zero
Imagine a U.S. bakery asking AI to write its weekly report. Three order cards show $20, $0 and a blank amount. The assistant reports an average of $6.67. The arithmetic can work, but only after silently treating an unknown amount as zero. This synthetic exercise is about reporting definitions, not a customer case or a revenue forecast.
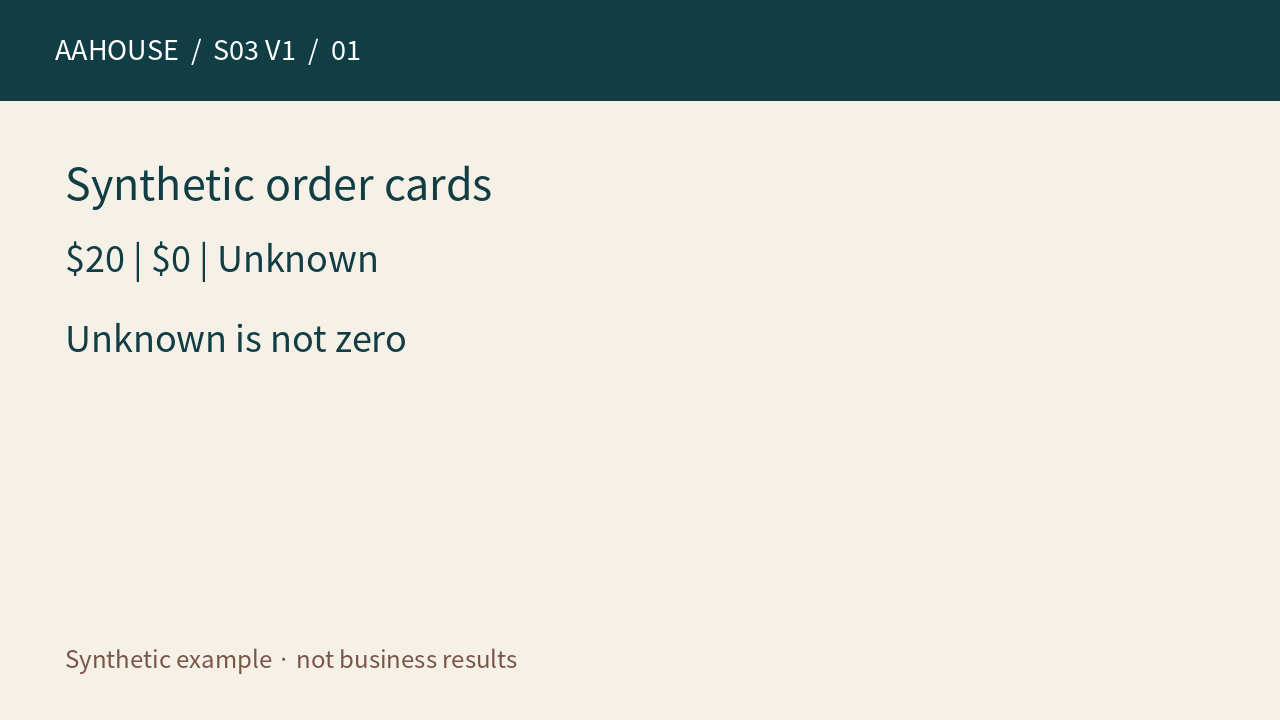
- $20 | $0 | Unknown
- Unknown is not zero
Unchanged original source explanatory diagram.
One input set, two denominators
PostgreSQL documents that COUNT(*) counts input rows, COUNT(amount) counts rows with a non-null amount, and AVG averages non-null inputs.[1] Our example has three rows and two known amounts, whose average is $10. That is the average of known amounts—not a known average for every order. The third amount still needs verification.
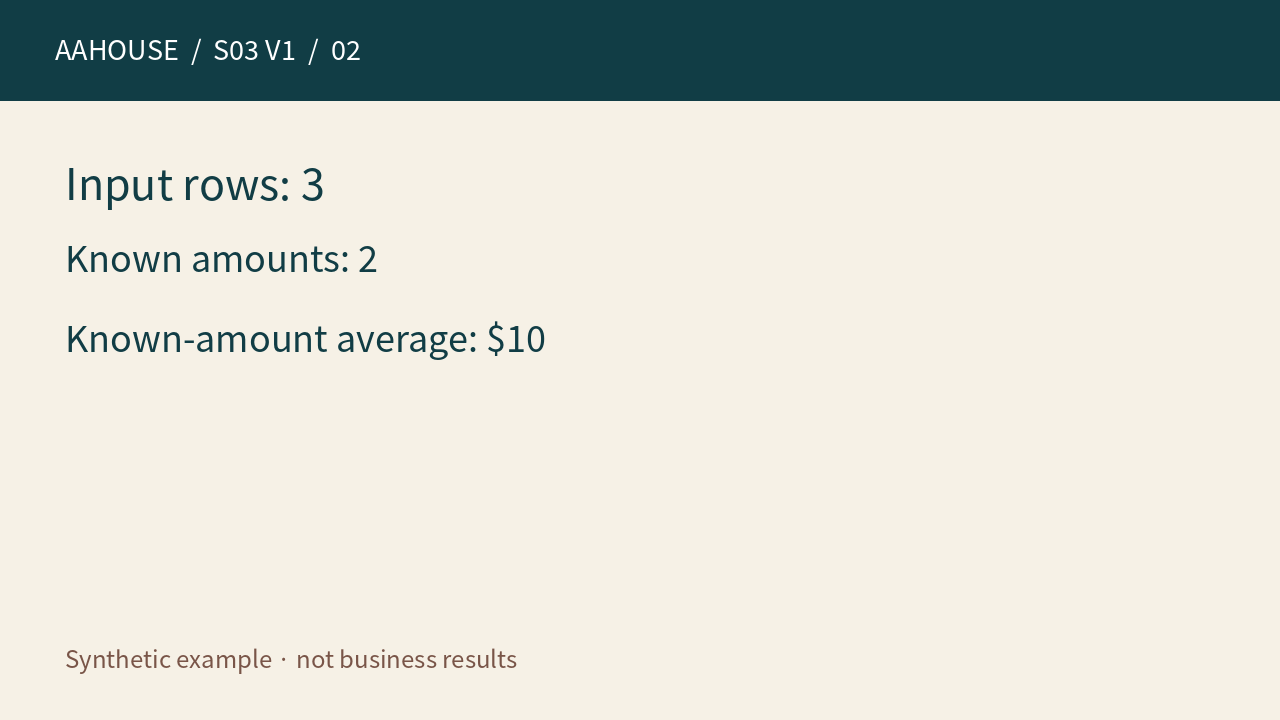
- Known amounts: 2
- Known-amount average: $10
Unchanged original source explanatory diagram.
Zero, unknown and no rows
Zero is a known numeric value; null means the value has not been supplied here; no input rows is a different state. PostgreSQL SUM returns null when there are no input rows, rather than zero.[1] That result alone does not prove there were no sales. Date filters, failed synchronization or permission scope could also leave a query empty. Investigate the business cause instead of asking the writer to guess.
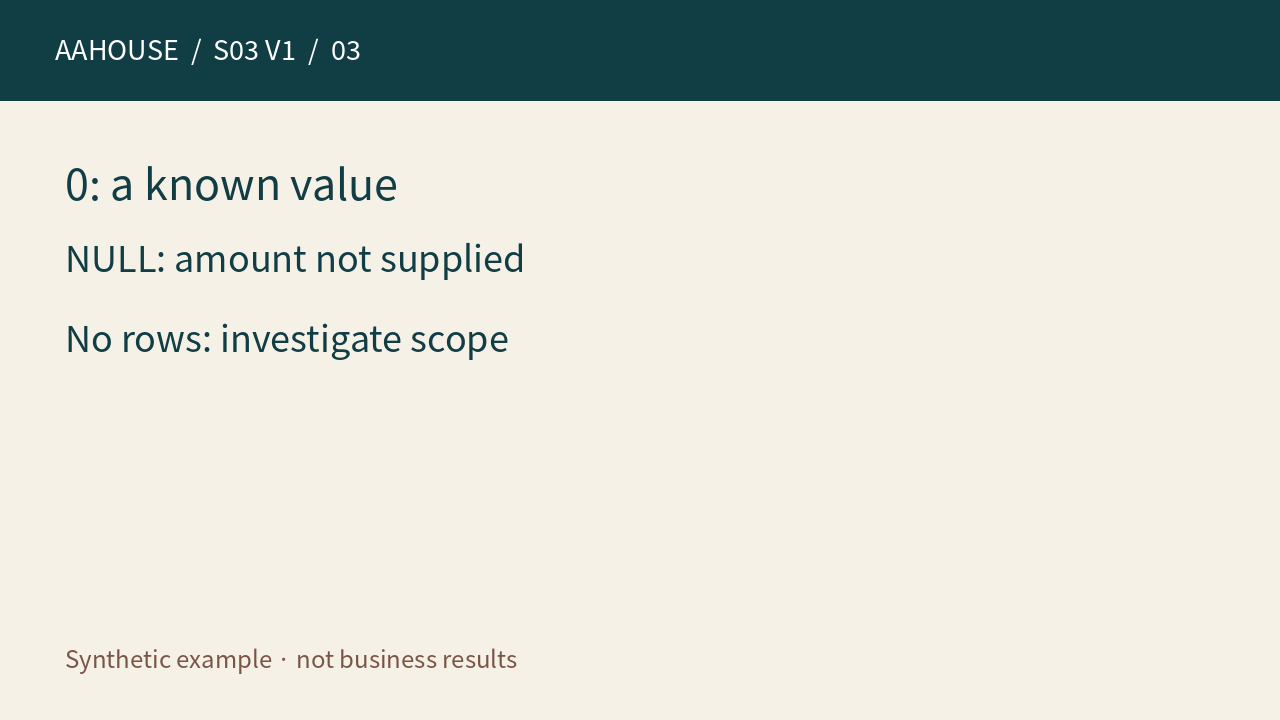
- NULL: amount not supplied
- No rows: investigate scope
Unchanged original source explanatory diagram.
Choose the policy before filling blanks
Replacing nulls with zero changes the statistical question. We recommend having the business owner define when zero is legitimate, how missing values appear, and which records qualify. Supply total rows, valid amounts, missing amounts and the reporting scope together. Label the metric “average of known amounts,” not just an impressive-looking number.
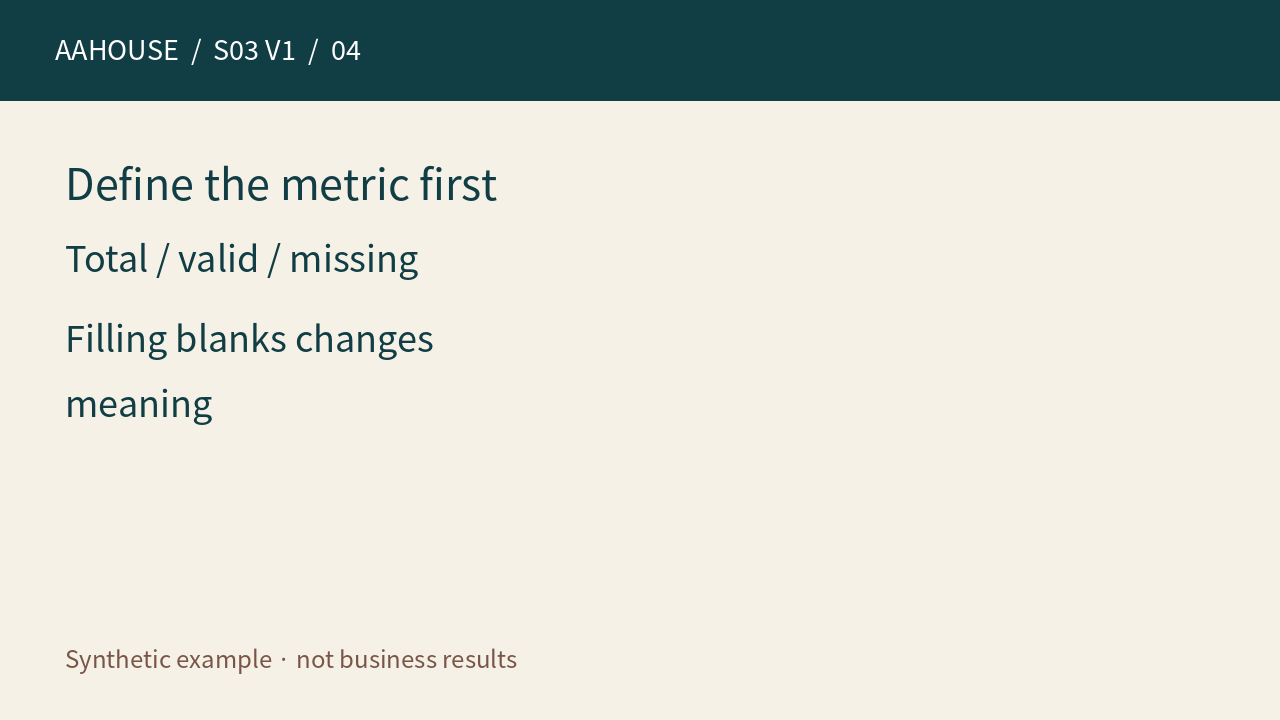
- Total / valid / missing
- Filling blanks changes meaning
Unchanged original source explanatory diagram.
Give the assistant an explainable result card
Our proposed result card records dates and time zone, filters, data freshness, total rows, valid-value count, aggregate result and completeness status. AI turns those fields into prose; missing amounts require a coverage caveat. For this synthetic example: two of three records have known amounts, averaging $10; one amount awaits verification.
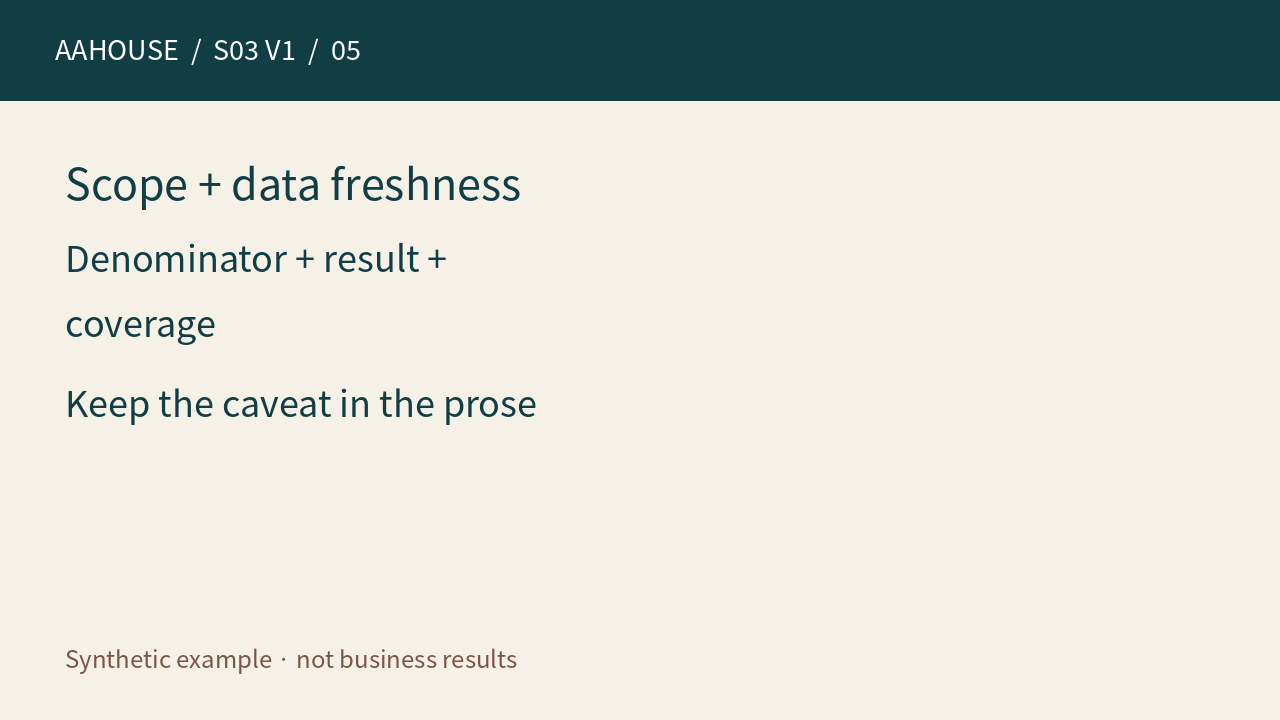
- Denominator + result + coverage
- Keep the caveat in the prose
Unchanged original source explanatory diagram.
Accept small tests, not confident wording
Before rollout, test four sets: all zeros; zero mixed with null; all nulls; and no rows. Check counts, aggregates and the final wording separately. The last two must not automatically become “no revenue this week.” These are proposed tests, not tests run on a customer system. Review the denominator and missing-data state before judging the prose.
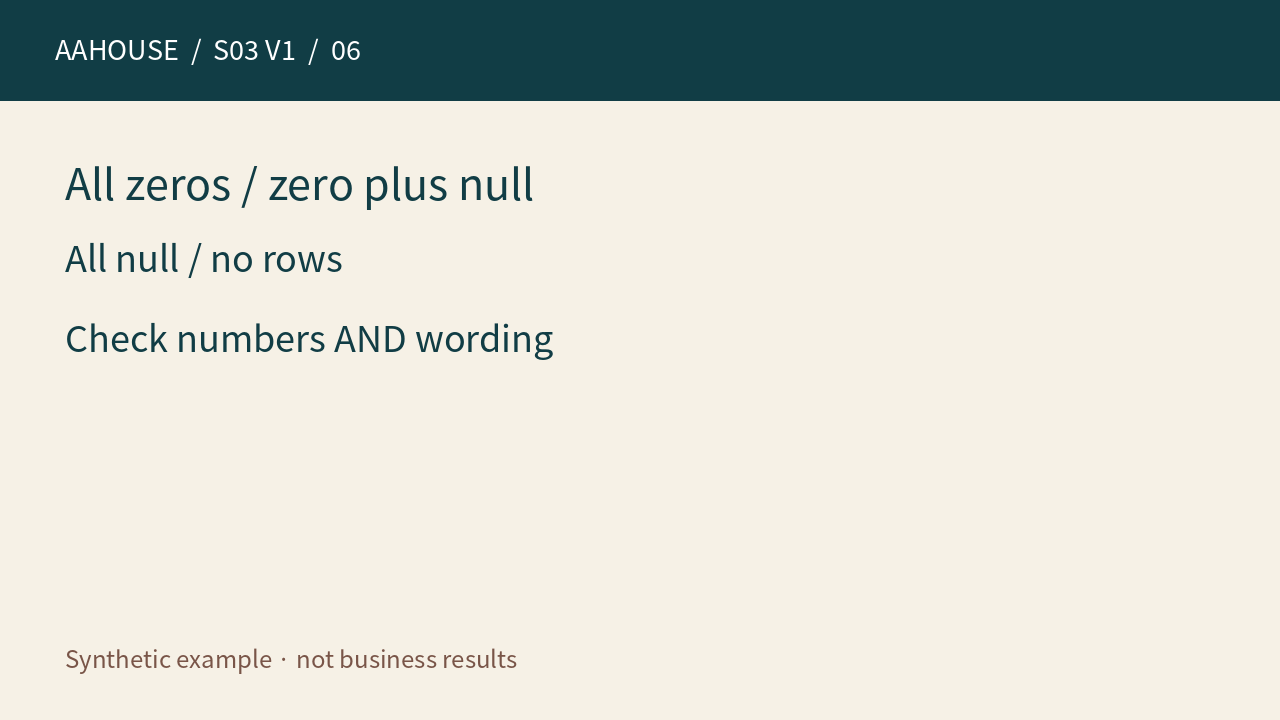
- All null / no rows
- Check numbers AND wording
Unchanged original source explanatory diagram.